Over the past few months, I've been test-driving various Docker-based local development environments with two goals in mind. First, as my "daily driver" for consulting work - I've been a long-time MAMP Pro user and I've been feeling for a long time that I need to modernize my local development tools. Second, I'm trying to figure out what is the most ideal local development environment for students of both our 12-week Drupal Career Online class (starts March 19) and our 6-week Mastering Professional Drupal Development Workflows with Pantheon (starts February 26) courses.
One of the necessary skills for a professional Drupal developer (one who codes either modules or themes) is to be able run a solid debugging tool. As part of my evaluation of Lando, I decided to figure out how to set up local PHP debugging with Xdebug and PhpStorm on Mac OS X.
This process described below is largely based on a comment in an issue thread in the Lando issue queue by David Hunt - thanks, David!
My local setup includes:
- Mac OS X Sierra 10.12.6
- Lando v3.0.0-beta.21
- Google Chrome with the Xdebug helper extension
- PhpStorm 2016.1.1
Starting point
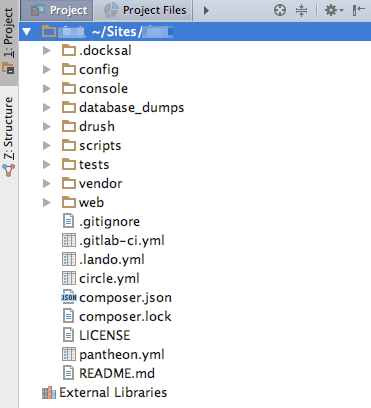
This tutorial assumes that you have a local Drupal site up-and-running in Lando and set up as a project in PhpStorm. In this example, my local site is using the Lando "Pantheon" recipe, but as you'll see in a bit, any recipe can be used. Also - my local site is based on the standard Drupal project composer template (with a nested docroot).
Enable Xdebug in Lando
The first step is to enable Xdebug in Lando - this is easily done by modifying the local site's .lando.yml file. In my case, I added the following:
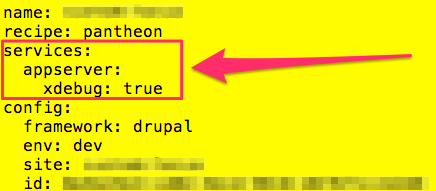
If your .lando.yml file is defining a custom appserver service, then you should be able to just add the "xdebug: true" bit to the appserver definition.
Once added, you'll need to perform a "lando rebuild" - this will rebuild your environment based on your .lando.yml, including adding Xdebug. The documentation page for the "rebuild" command includes a caution about how there's no guarantee that data will persist between rebuilds. In my experience, I haven't had any issues with losing my database. If you're concerned, then you may want to perform a "lando db-export" prior to rebuilding.
Configuring PhpStorm
Here's where some magic comes in. Admittedly, I don't fully understand the details of some of the configuration necessary in PhpStorm to get debugging working, but I can confirm that following these steps, it has worked every time for me so far.
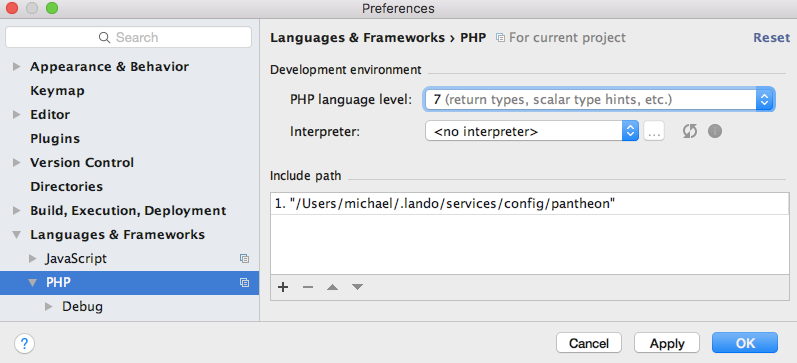
The first step is to add the Lando recipe folder as an "Include path" in your PhpStorm project. Open Preferences > Languages & Frameworks > PHP, click the "+" button at the bottom of the list, and manually type in the name of the folder of the Lando recipe you're using. On my machine it is: /Users/michael/.lando/services/config/pantheon. If you're using the standard "Drupal8" recipe, then it would be: /Users/michael/.lando/services/config/drupal8. Unless your username is also "michael", you'll want to update the path.
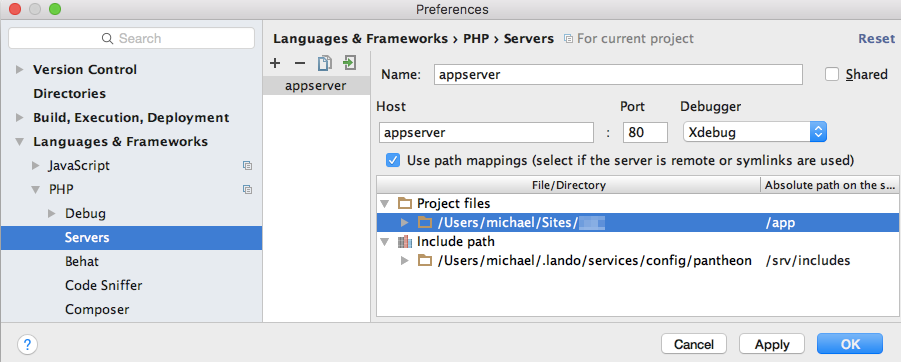
Then, go to Preferences > Languages & Frameworks > PHP > Servers
 If no server for your project exists (it might be called “appserver”), then enable PhpStorm to listen for Xdebug connections, load a page from your local site in your browser and PhpStorm will prompt you to accept the incoming connection. In my case, it didn’t matter if the Xdebug helper is set to debugging or disabled at this point.
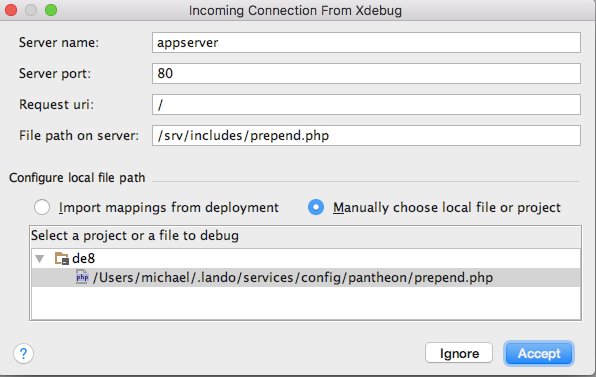
Then, once a server for your local site exists (remember, it might be called "appserver”), select it and ensure that "Use path mappings" is checked, and ensure that your project folder is mapped to "/app" for the "Absolute path on server". Also ensure that the "Absolute path for the server" for the “include path” is "/srv/includes".
Give it a try!
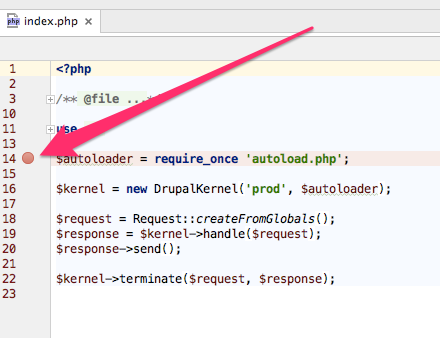
At this point, we should be ready for debugging! As a test, open up the site's index.php in PhpStorm and place a breakpoint.
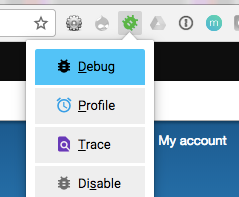
Then, using the Xdebug Helper extension, enable debugging. Also ensure that PhpStorm is still set to listen to incoming Xdebug connections.
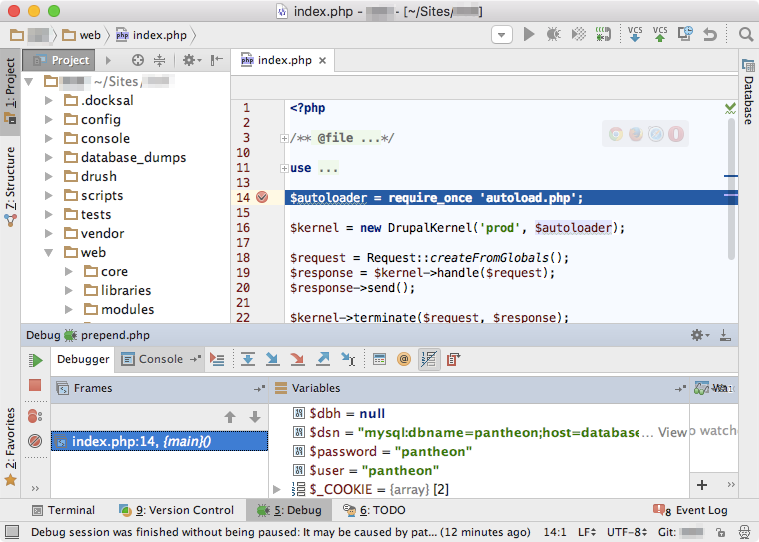
Finally, load your local site's home and watch how PhpStorm will pause code execution at your breakpoint in the index.php file.
Warning - performance will suffer
While Xdebug is a powerful tool and will absolutely save you loads of time, there's a dark side. Performance will suffer. I recommend disabling Xdebug in your .lando.yml - by setting "xdebug: false" - (and rebuilding) when you're not using it. You can leave it enabled and gain back some (but not all) performance by disabling PhpStorm's listener as well.
Final thoughts
In case you're wondering where some of the configuration settings come from, here's what I've figured out so far:
- "appserver" is the name of the Lando service that contains the codebase.
- "/app" is the absolute path of the codebase in the "appserver" Docker container.
- "/srv/includes" is the absolute path to a Lando-provided "prepend.php" file in the "appserver" Docker container. As far as I can tell, this file defines and sets a bunch of environment variables depending on the recipe used.

Comments
PHP storm fails validation …
PHP storm fails validation (Run-->Webserver Debug Validation stating that remote debug is not enabled when lando php -i reports that remote debug is set to true.
XDEBUG_CONFIG => remote_enable=true
At this point I followed the directions on the lando site for using a custom php.ini file to over-ride default php.ini but the results were the same.
Tried on Mac and PC
I prefer to have xdebug only…
I prefer to have xdebug only started on demand, i.e. using a url parameter or browser extension, in order to not lose a lot of performance. To do that, you'd first set
xdebug: falsein your .lando.yml (or simply remove it again), then configure the path to a custom php.ini file to additionally load:config:conf:
php: .lando/php.ini
Create
.lando/php.ini, and add the following xdebug settings:xdebug.remote_autostart = Offxdebug.remote_host = ${LANDO_HOST_IP}
Since autostart was enabled in Lando's PHP settings, we need to disable it first. Setting the proper remote host IP is required for Docker for Mac.
Thanks for sharing your…
Thanks for sharing your custom php.ini settings. This is exactly what I was looking for.
I got the website debugging…
I got the website debugging working. Now `lando drush` (cli) commands don't seem to trigger remote xdebug, can you add a drush section?
Johnathan, I haven't had…
Johnathan,
I haven't had the need to debug Drush commands yet, so I haven't put the time into getting Drush commands working with Xdebug. If anyone has any tips, hopefully they'll post them below.
-mike
I have not yet tested it…
I have not yet tested it with lando, but when I was debugging with a virtual machine I used the following script on host to start a debug session:
sh/php-debug.sh
#!/bin/bash
FQDN=`hostname -f`
REMOTE=$1
if [[ -z "$REMOTE" ]]
then
#echo "A remote host to connect to for debugging must be provided."
#echo "Example: drush-debug.sh example.lan"
#exit 1
REMOTE=192.168.129.1
fi
#export PHP_IDE_CONFIG="serverName=$FQDN"
export PHP_IDE_CONFIG="serverName=example.com"
export XDEBUG_CONFIG="idekey=PHPSTORM remote_host=$REMOTE"
echo "PHP_IDE_CONFIG="$PHP_IDE_CONFIG
echo "XDEBUG_CONFIG="$XDEBUG_CONFIG
echo "Starting a new shell with xdebug enabled. Exit the shell to disable debugging."
bash
I believe you need to add …
I believe you need to add "PHP_IDE_CONFIG" to your lando configuration. Note the service name matching the "serverName" environment variable at the end.
services:

  appserver:

    xdebug: true

    overrides:

      services:

        environment:

          # Support debugging Drush with XDEBUG. Use lando drush to debug.

          PHP_IDE_CONFIG: "serverName=appserver"
I found this thread https:/…
I found this thread https://github.com/lando/lando/issues/1668 that offered a great solution to address the performance issue.
That's a solid solution!
That's a solid solution!